About
What question you are looking to answer?, Why does this question matter?
I am a sports fan, and while I am a triathlete who loves his sport I enjoy watching many other sports like tennis, F1, soccer and football. When you are among friends and family who are passionate about sports like me, it is inevitable to call winners for any match you see or expect to attend. Is like betting but without the downside of losing money. You actually gain respect if you are consistent at calling winners, and you gain a reputation if you end up constantly calling losers. So, I decided to improve my chance to be the one who says: I told you so. The difference being, I may have something to support my claim rather that just call it.
What data did you use? Where you got the data?
Initially, I decided to get statistical data for each team. Yards per game, scores, goal fields and so on. The best model I’ve found so far is to use the game scores and additional information like which team is visiting and parameters for the Elo rating calculation. I have included the performance of each team in the last x number of games to update the Elo rating.
The data used to build the models was collected from two sources: the NFL site to get the offensive and defensive stats for all teams, and the historical match results from pro-football-reference.com. These guys have arrange the data on a way that is quite easy to crawl for all match results since 1920 when the league was founded. The spreads were collected aussportsbetting.com, updates are taken from oddsshark.com.
How was the data sampled? How was the data obtained?
The data samples for training the models increases its records after each game. The final model uses the Elo rating as the primary attribute to predict a match result. It starts at the same value for all teams. After each game is completed the rating is updated, becoming part of the sample data. For other models, the data in the training sample started with data from 1990 to 2009. Predictions are made for the entire 2010 season; the season in complete data from 2010 is included in the training sample. The same process is executed up to 2016. Initial data from NFL.com and pro-footbal-reference.com was pull from using Python crawlers. From the official league website stats from 1990 to 2016 week 9 was gathered. Games scores and result for the same period were similarly collected. From week 11 an automatic process gets all new data from the NFL official site with the same python crawler. Las Vegas spreads are now being updated from oddshark.com.
How did you explore the data? How did you model the data?
To start my analysis I looked at the data to see which variables seem to have relevant information on team performance. Using correlation measurements and distributions, I was able to get an idea of which approach to take. I will make some of those visualizations available later in the blog. From the NFL stats you get different measurements for the performance of each team. Initially, I try different combinations of that statistical data to train different models.
How did you fit the model?
I created an ensemble model that combined the result of ridge, lasso and elastic net regressions. The best model however takes the Elo rating, a variable to identify if the team is visiting or playing at home to predict a winner. Elo rating may be computed after each game is played taking into its value the performance of the team. I decided to go with an ensemble model since the algorithms provided different types of outputs and the accuracy has great variation for a single model. The implementation of Elo rating came across when I was selecting my the benchmarks to my model. For the ensemble model the process is as follows: for each match in a given season the training data includes the performance data of the teams in the game up to the season before the one to be predicted. For example, the prediction for the game between Colts and Cardinals on the week 13 in 2013 the training data included performance data from 1990 to 2012. Then the performance of the 2013 season, from week 1 to week 12 is fitted to the model. In the ensemble each model provides a score for each team, the taking the average score a winner is selected.
Starting week 15 a new Elo rating is implemented. The previous rating provides an advantage to the team playing locally. However this may not alway be the best approach. Why? Historically, the advantage goes for the team playing at home, but what if we base this advantage looking into recent history? We may learn that the advantage should be greater or maybe it should be the other way around. Look at the 49ers, you just can’t be sure they are more favored when playing at San Francisco. This adjustment gives greater points to an underdog that wins a game, causing more damage to the Elo rating of the favourite team. And it gives less points when a clear favourite wins to a poor performing team. We may see that a team that has a difficult season even when is no t the best (measured by games won) by wining teams that are better in paper would compensate the team. The new Elo was back-test with good results so I have updated the predictions going forward and track record to match the new rating.
How did you validated the model? How you know the results make sense?
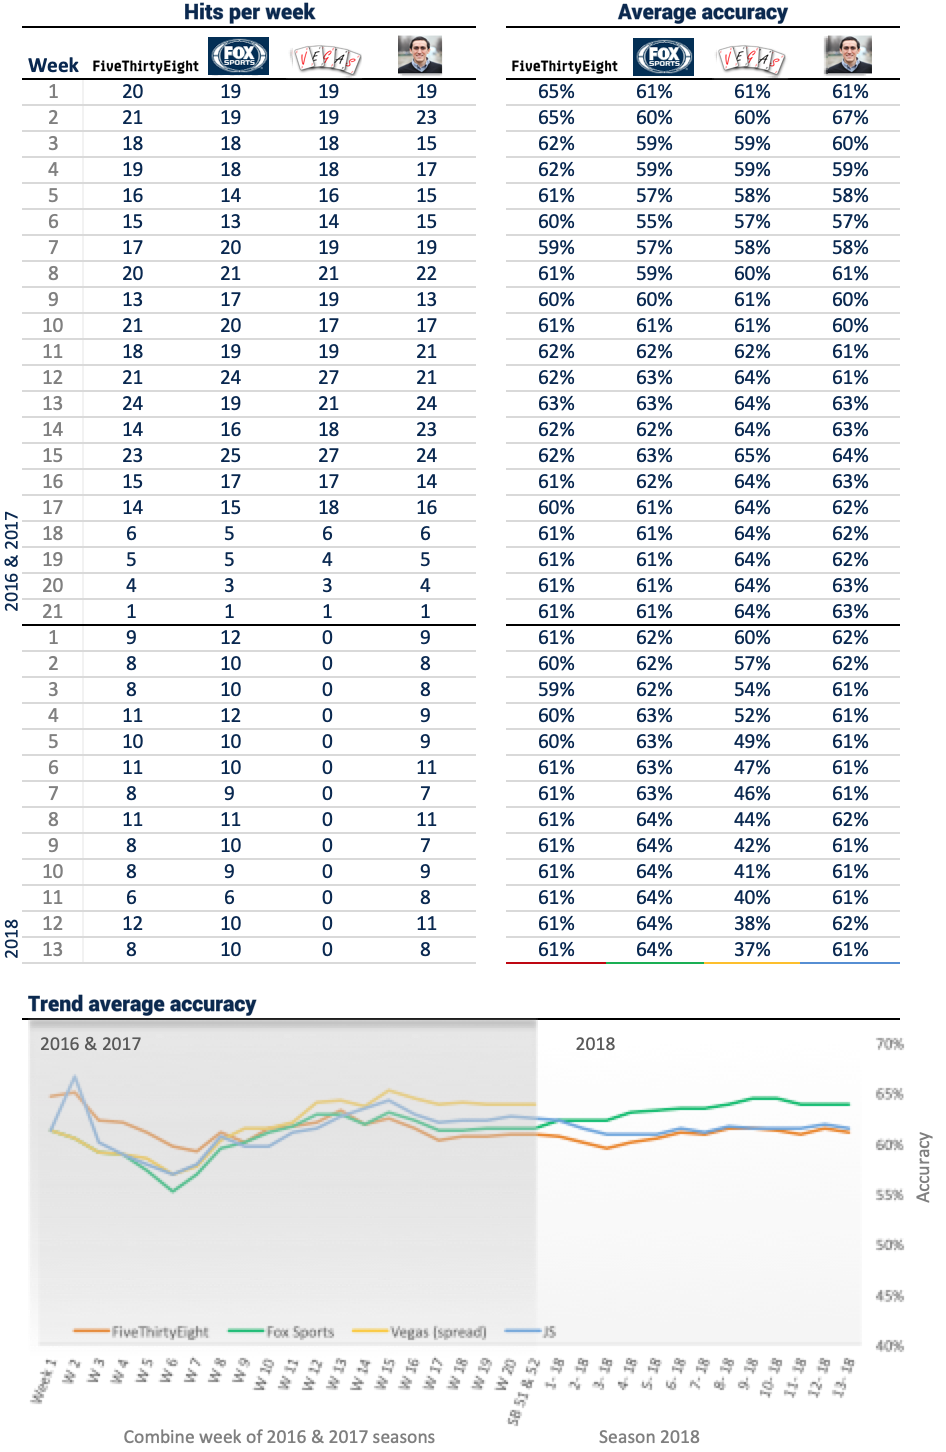
The model is tested for each game between 2010 and 2018, a period in which more than 1,800 games were played. In addition, 3 benchmarks were selected to see the results against other models. I included FiveThirtyEight, Fox Sports and Vegas odds spreads. Each bench provides different approaches to select winners, and the models I build get similar results when calling winners.
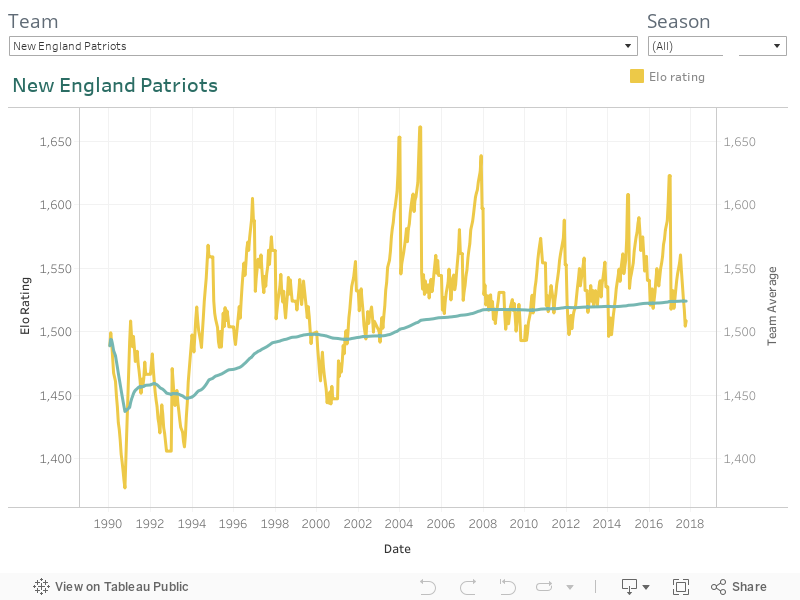
Results and adjusted predictions for upcoming games are updated automatically in four sections of this post. Weekly forecast contains the predicted and actual winner for each game since 2010 including playoffs of 2016. Since Elo rating is computed in the section, Team Ranking is possible to see the ranking ordered by the probabilities of winning the Super Bowl for each team. The probabilities are obtained by running a 10k MC simulation. The third section contains a comparison of the model to the benchmarks. It presents the accumulated average recall of winners per week for the 2016 season. Finally, the Elo for each team is presented using Tableau.
All models were implemented in Python 3.4 using scikit-learn package to run the ML algorithms. Elo rating is also computed in Python with custom code.